-
§ AUGUR / NETWORK
Augur
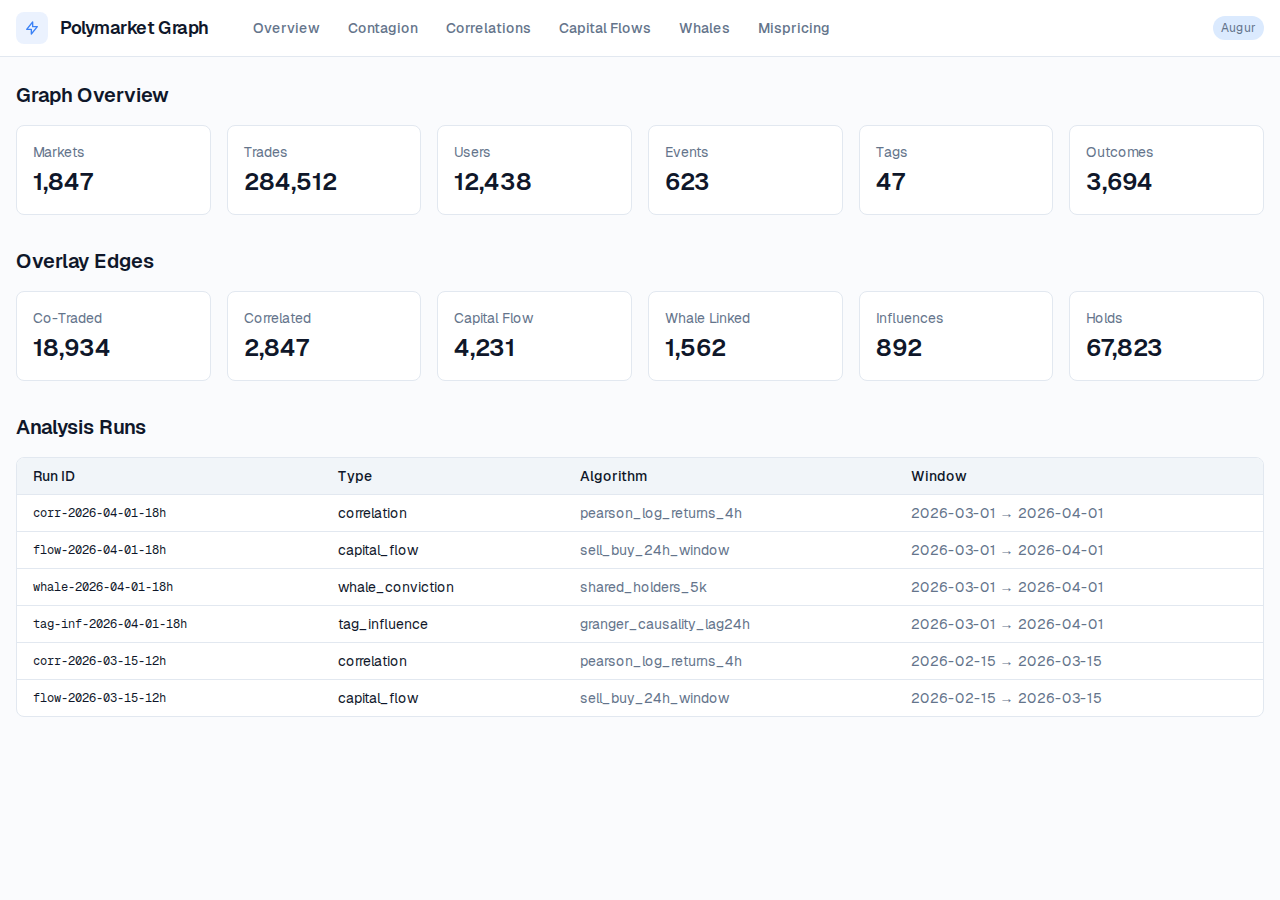
Polymarket prediction market graph analyzing cross-domain contagion, correlated price movements, capital flows, and whale conviction patterns across 1,800+ markets.
StackMemgraph · Python · FastAPI · Next.js · D3.js · Tailwind CSS- GraphMemgraph stores 6 node types (Market, Trade, User, Event, Tag, Outcome) with statistical overlays (CO_TRADED, CORRELATED, CAPITAL_FLOW, WHALE_LINKED).
- Time Series4-hour price bucketing for Pearson correlation; Granger causality lag detection across markets.
- Anomaly DetectionMispricing identification where correlated markets diverge in price; whale clustering as outlier behavior.
- Granger causality inference to identify which markets lead others, with prediction error scoring for information leakage.
- Real-time streaming pipeline (Kafka to Memgraph to WebSocket) replacing static data snapshots.
- Arbitrage exploit detection integrating AMM liquidity curves with slippage estimates and fill simulation.
-
§ BAROS / INDEX
Baros
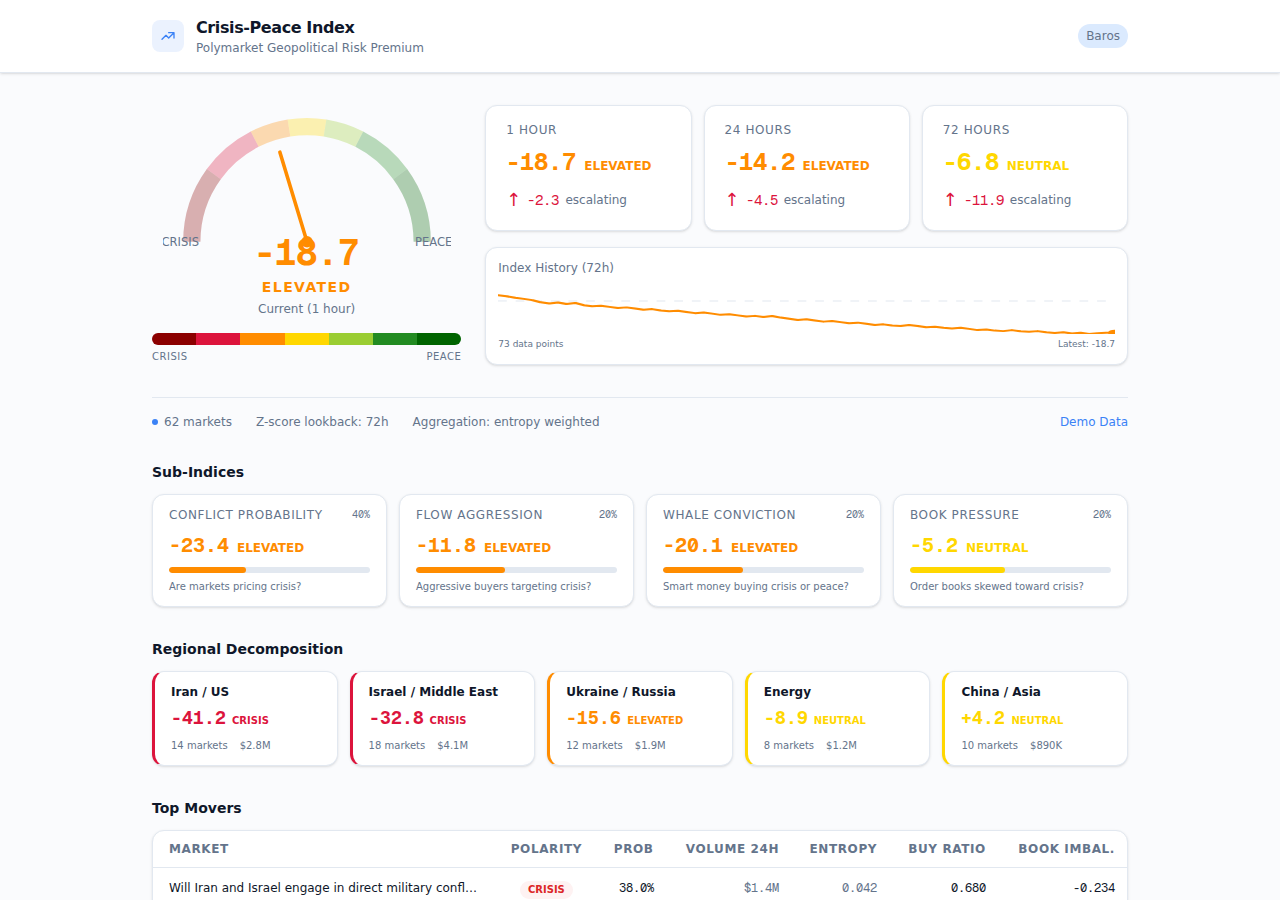
Composite crisis-peace index fusing 62 Polymarket geopolitical prediction markets with Global Peace Index (GPR) indicators to surface emerging geopolitical risk before traditional indicators react.
StackClickHouse · Kafka · Python · FastAPI · Next.js · Tailwind CSS- Time SeriesClickHouse stores intraday market snapshots; composite index is a forecastable time series (ARIMA, Prophet, or LLM-based).
- Ensemble MethodsWeighted aggregation of Polymarket sentiment and GPR indicators; weights tunable per geopolitical zone.
- NLPMarket descriptions parsed for geopolitical keywords (sanctions, military, border); LLM-based semantic risk scoring.
- Multi-scale time-series decomposition (STL/wavelet) to separate trend, seasonality, and anomalies across historical geopolitical events.
- Regional sub-indices (Middle East, South China Sea, Eastern Europe) with separate weighting schemes.
- LLM-powered news-to-risk pipeline feeding Reuters/AP newswire through event extraction and auto-tagging markets.
-
§ PALIMPSEST / ANALYTICS
Palimpsest
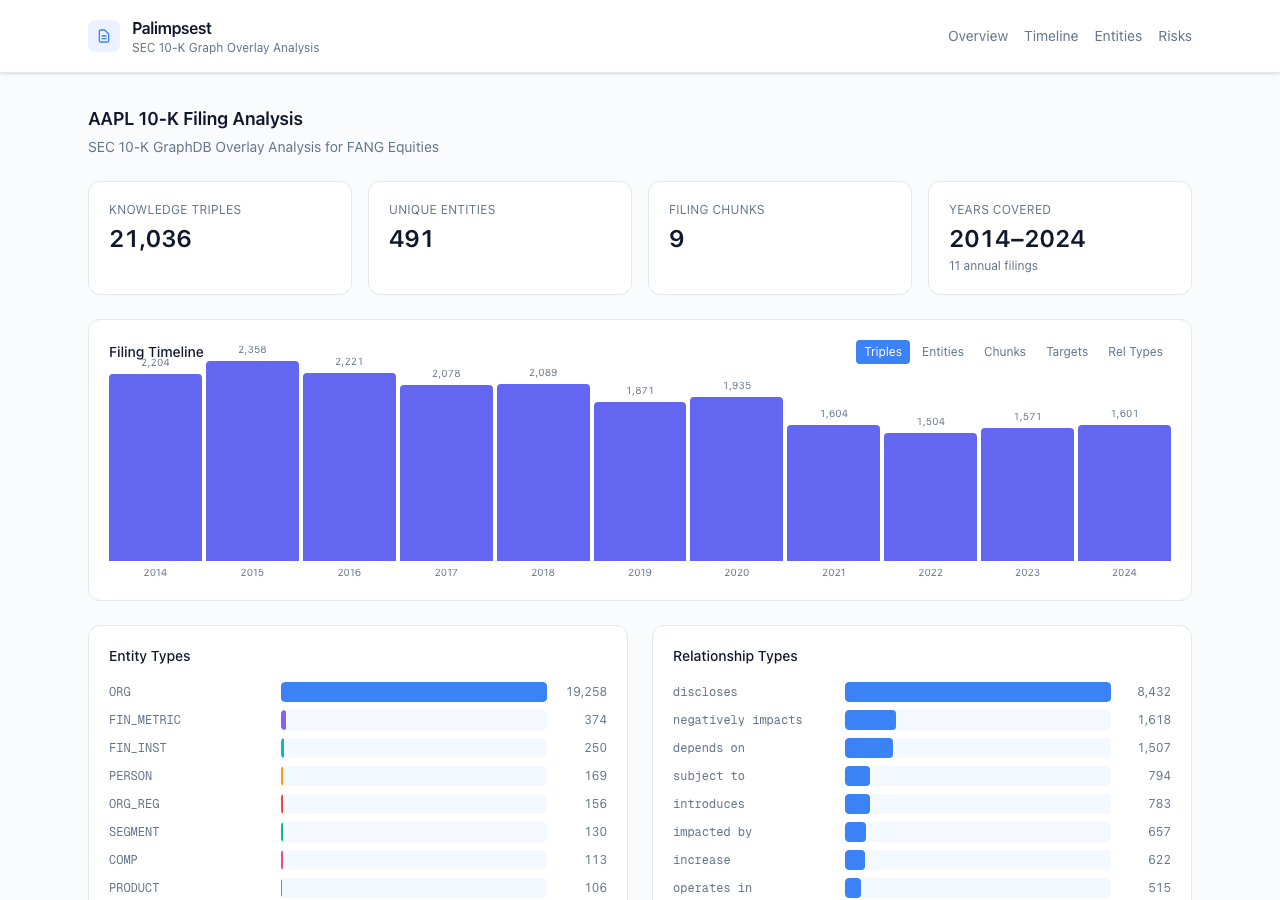
SEC 10-K knowledge graph overlay for FANG equities, extracting 4.4M structured triples from filings to expose risk disclosure patterns, strategic shifts, and hidden supply chain dependencies across companies and years.
StackNeo4j · Python · HuggingFace Datasets · FinReflectKG · Next.js · Tailwind CSS- NLPLLM-based information extraction converts unstructured 10-K prose into (subject, predicate, object) triples; NER identifies RISK_FACTOR, FIN_METRIC, PRODUCT, SEGMENT entities.
- GraphNeo4j queries compute entity centrality, risk clustering, and temporal evolution of disclosure patterns across filings.
- VectorJaccard similarity of risk sets between FANG companies; entity density scoring reveals how much explanation companies devote to specific risks.
- Cross-FANG comparative analysis adding META, GOOGL, NFLX, AMZN with side-by-side risk profiles and asymmetric exposure detection.
- Causal inference linking extracted risks to stock price movements via causal forest or Granger causality.
- Supply chain reconstruction from entity-link predicates to identify single-point-of-failure suppliers across multiple 10-Ks.
-
§ PELAGOS / RISK MODEL
Pelagos
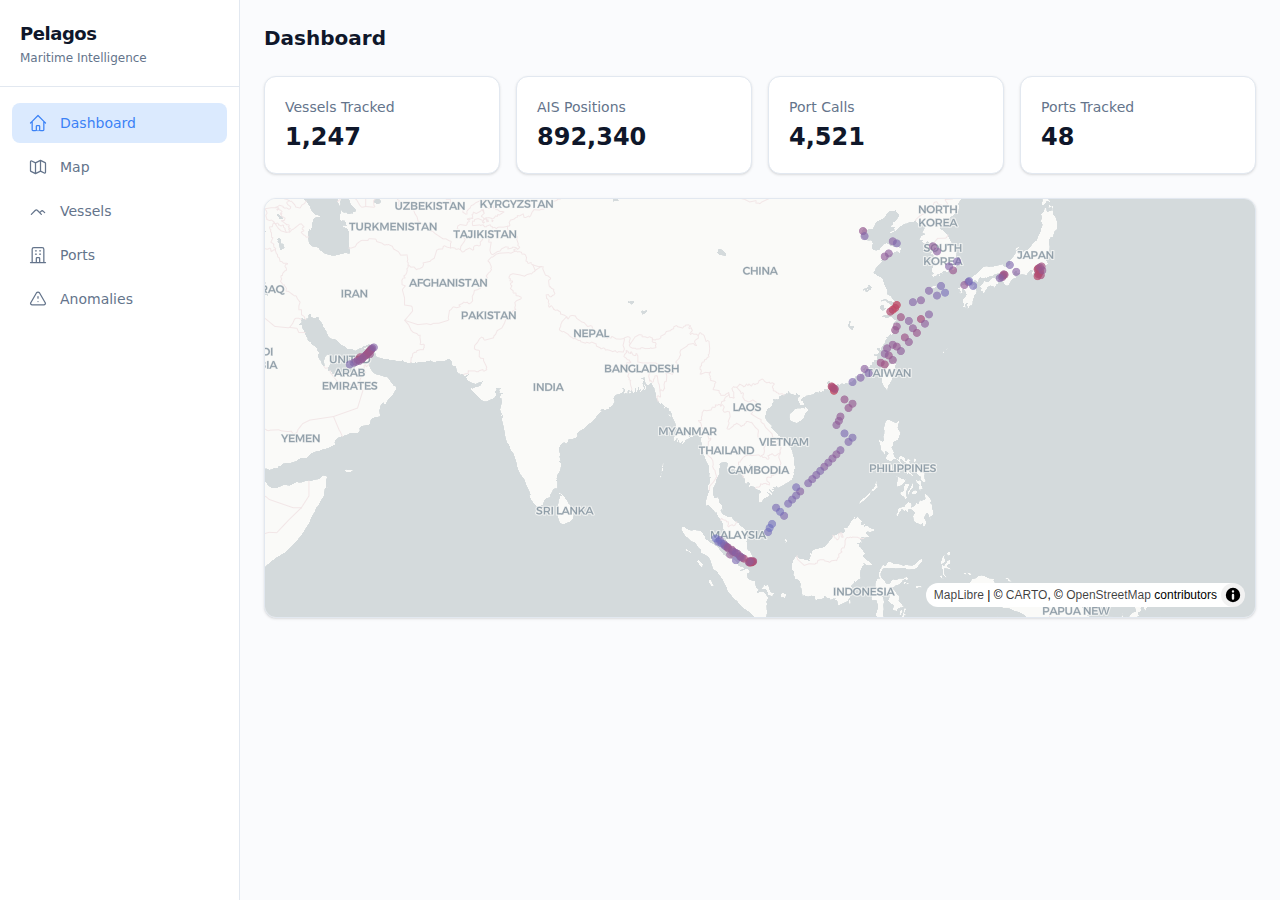
Maritime supply chain disruption risk platform ingesting AIS vessel tracking, port congestion signals, and Polymarket logistics markets to identify emerging disruptions before they impact earnings.
StackNeo4j · ClickHouse · Bytewax · Kafka · Python · FastAPI · Next.js · Deck.gl · Maplibre · Tailwind CSS- Geospatial MLBytewax processes streaming AIS data with Rtree spatial indexing and Shapely geofencing for route anomaly detection.
- Time SeriesVessel speed/heading over time; port occupancy forecasting; statistical process control on dwell time and queue length.
- GraphNeo4j encodes fleet ownership networks, inter-port shipping patterns, and vessel operational constraints to detect bottleneck routes.
- Predictive port queue models using Prophet/LSTM to forecast occupancy and alert on projected 7+ day queues in high-margin corridors.
- Commodity supply chain impact simulation tracing electronics, oil, and rare earths through the graph with disruption scenario modeling.
- Multi-modal fusion integrating satellite imagery for port congestion estimation with AIS spoofing detection classifiers.
-
§ YATAGARASU / PLATFORM
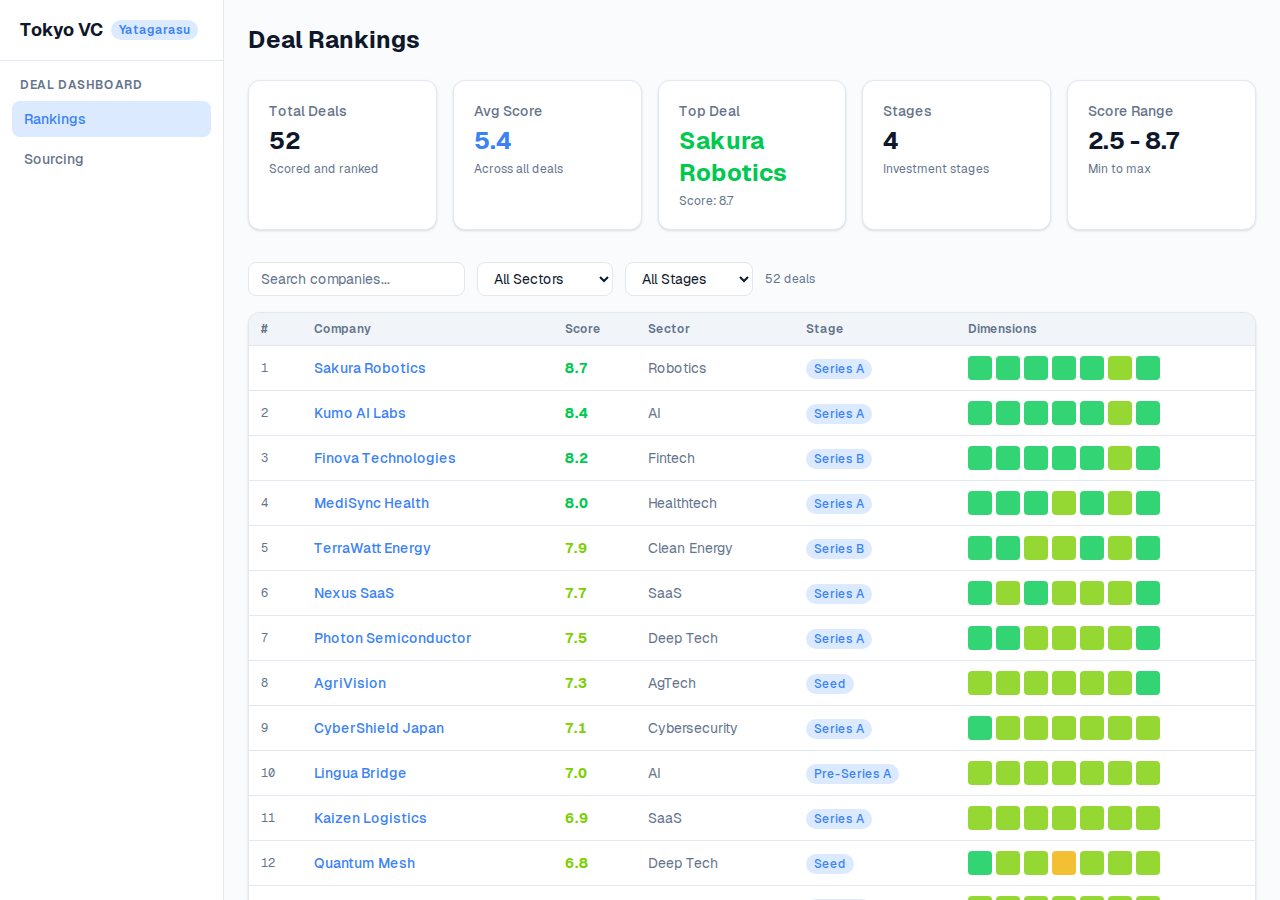
Yatagarasu
LangGraph agent swarm for Japan-focused VC that sources, researches, and scores startup deals across 7 weighted dimensions using parallel LLM agents, web search, and vector memory to output ranked deal lists with investment memos.
StackLangGraph · Novita AI · Qdrant · ClickHouse · Tavily · Perplexity · Python · FastAPI · Next.js · ECharts · Tailwind CSS- AgenticLangGraph orchestrates 7 parallel scoring agents (market, team, product, traction, syndication, risk, japan_fit) with dynamic tool routing.
- LLMEach dimension agent uses chain-of-thought scoring with JSON schema constraints; output formatter generates natural-language investment memos.
- RAGQdrant stores past research for recall; Perplexity provides sourced citations; Parallel.ai discovers comparable companies.
- Portfolio-level impact scoring computing how each deal affects portfolio risk, sector concentration, and FX/geopolitical hedging.
- Founder social proof integration scraping Crunchbase, LinkedIn, and AngelList for network size and past investor reviews.
- Preference learning feedback loop accepting investor pass/invest decisions to fine-tune dimension weights via Bradley-Terry model.
-
§ CHREMATA / ANALYTICS
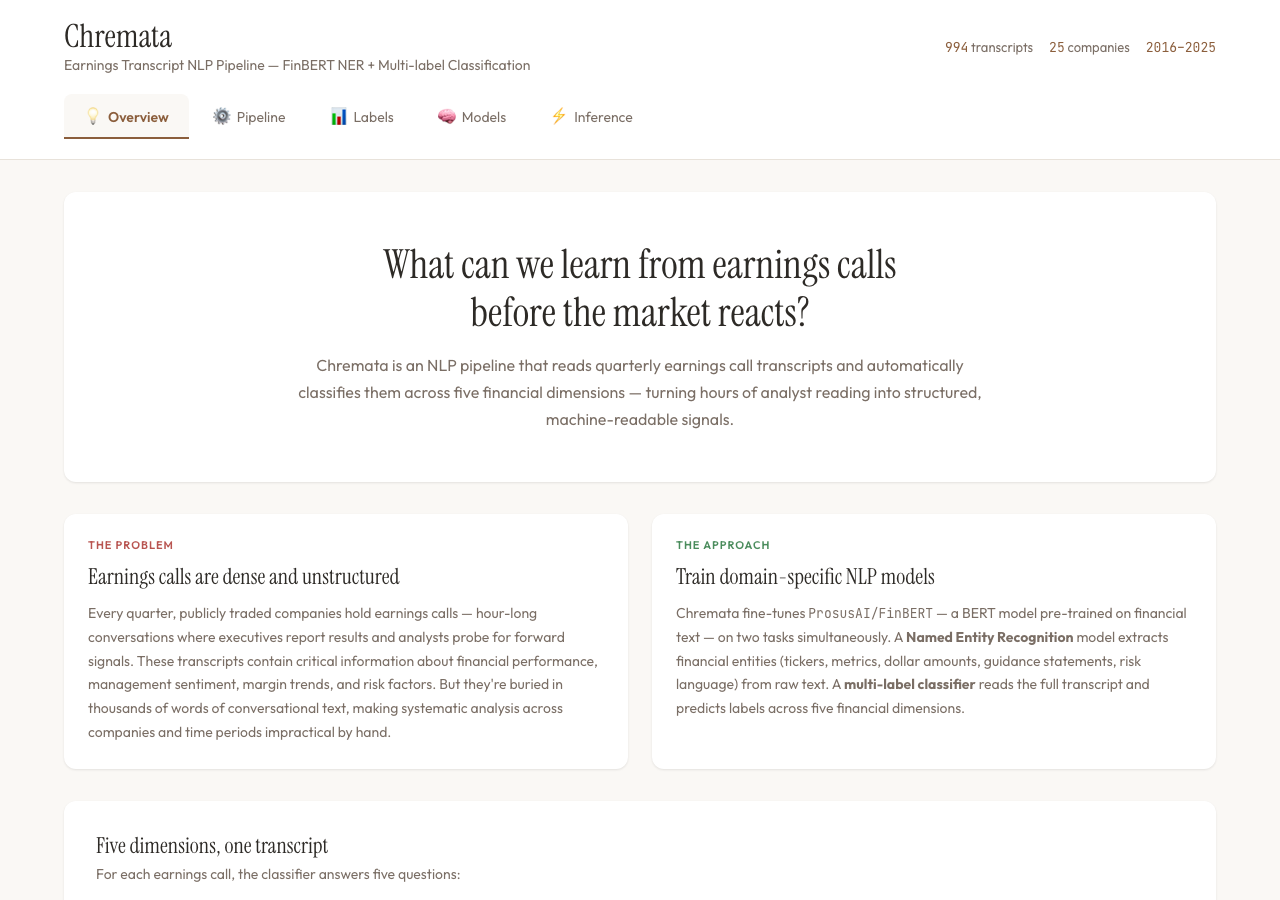
Chremata
Earnings transcript NLP pipeline classifying call transcripts across 5 dimensions (outcome, guidance, tone, margins, headwinds) with model performance metrics, label distribution analysis, and interactive inference exploration.
StackPython · React · Babel · SVG Charts- NLPMulti-label classification of earnings transcripts into outcome, guidance, tone, margins, and headwinds dimensions using a custom 14-class taxonomy.
- NERNamed entity extraction from financial text identifying risk factors, financial metrics, products, and business segments.
- EvaluationPrecision, recall, and F1 scoring across all classification dimensions with per-label confusion analysis and radar chart visualization.
- Multi-quarter trend analysis tracking how company tone and guidance shift across consecutive earnings periods.
- Expanded company coverage beyond current dataset with automated transcript ingestion pipeline.
- Real-time earnings call processing with streaming classification updates during live calls.
-
§ KITSUNE / RESEARCH
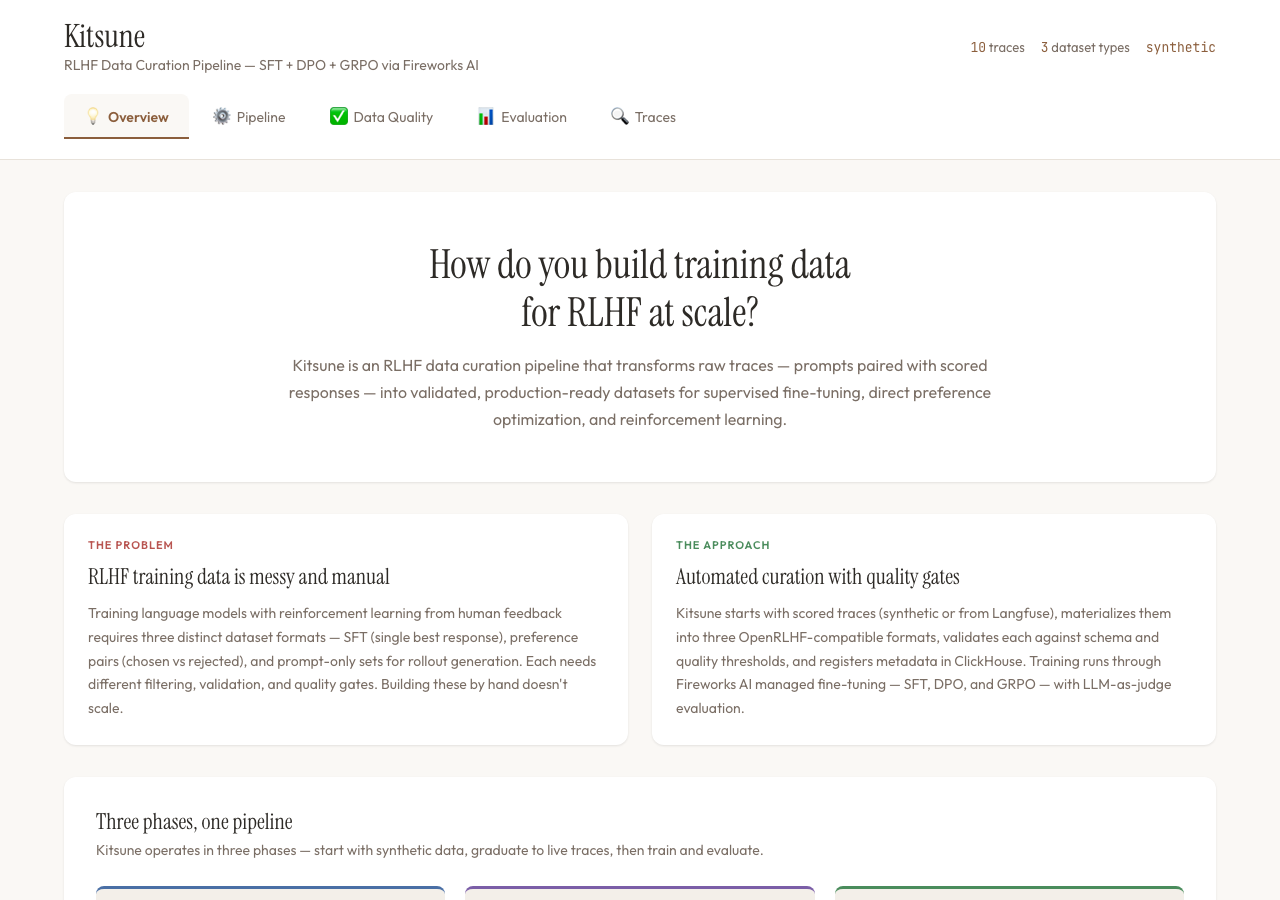
Kitsune
RLHF data curation pipeline dashboard visualizing trace generation, dataset materialization (SFT, preference pairs, prompts), validation gates, and fine-tuning evaluation comparing base and fine-tuned models with win rate scoring.
StackPython · React · Babel · SVG Charts- RLHFReinforcement learning from human feedback data curation with trace scoring, preference pair construction, and SFT dataset materialization.
- EvaluationBase model vs fine-tuned model comparison with win rates, score deltas, refusal rate tracking, and judge-model assessment.
- Data QualitySchema validation and quality gates across materialized datasets with pass ratios, duplicate detection, and invalid record flagging.
- Expanded trace generation with configurable scoring rubrics and domain-specific quality criteria.
- Multi-model comparison dashboard supporting arbitrary model pairs with statistical significance testing.
- Automated quality threshold tuning based on downstream fine-tuning performance feedback loops.
-
§ KITSUNE-B / SDR COACHING
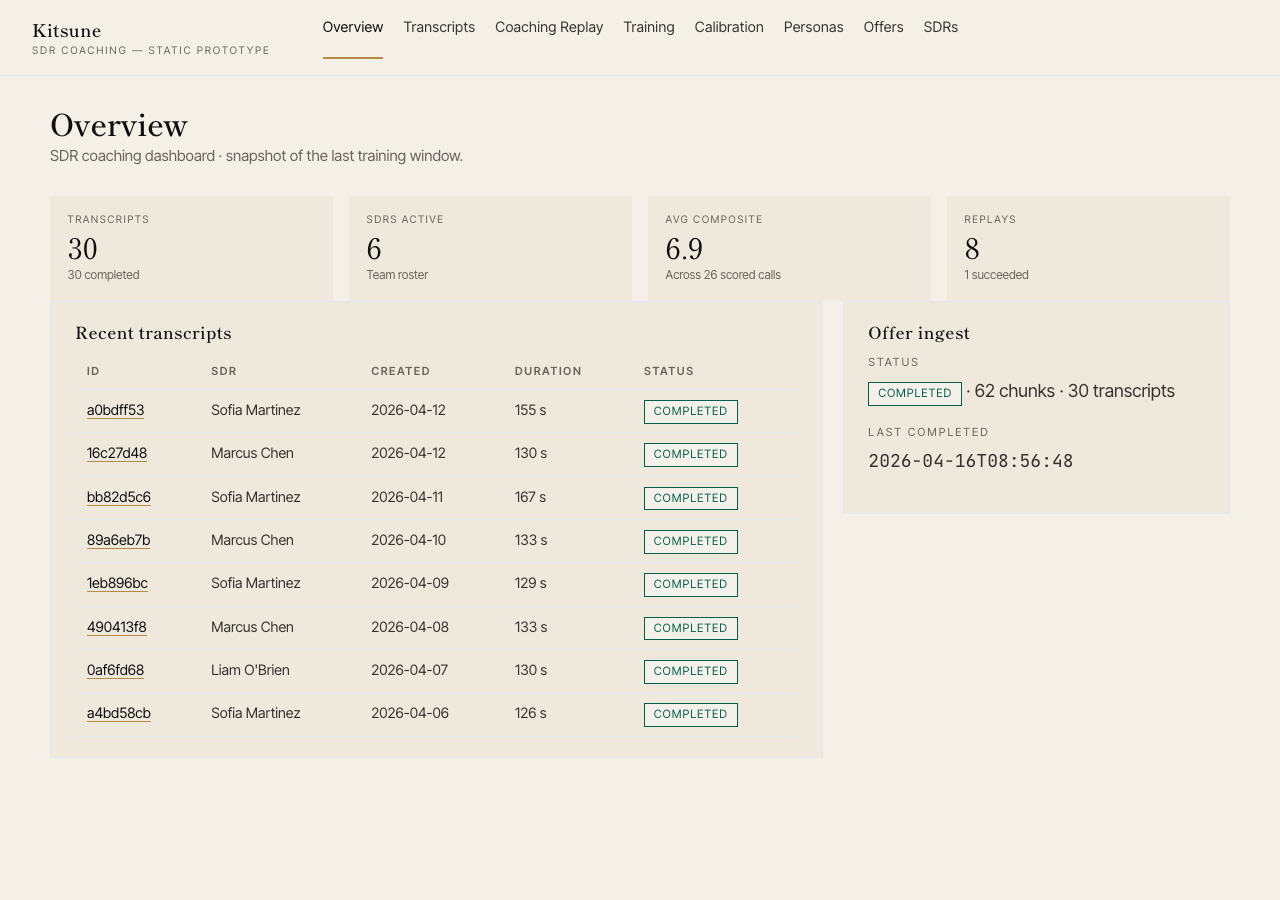
Kitsune-B
Static design snapshot of an SDR coaching dashboard frozen against real API data — overview, transcripts, hostile-judge analysis, coaching replay diff viewer, training role-play sessions, calibration distributions, and per-SDR weekly reports.
StackPython · Static HTML · Kintsugi CSS- Coaching8-dim hostile-judge scoring with coaching moments, per-dim lift, and side-by-side diff viewer between recorded and replayed turns.
- Role-playRed/Blue/Judge training sessions with turn-by-turn judge scorecards and branch exploration.
- CalibrationWeekly score-distribution stats and SDR composite averages with heatmap rendering across coaching dimensions.
- Live data wiring back to the sdr-transcripts API instead of frozen JSON fixtures.
- Interactive radar overlay with brushing across calls and time windows.
- Coach-authored rubric editor with versioned rubric history and downstream score recomputation.